Why continuous cloud security monitoring actually matters
Continuous cloud security monitoring sounds like vendor hype, but in practice it means one simple thing: you always know “what’s going on” with your workloads, configs and identities. Instead of doing a big audit once a year, you use serviços de monitoramento contínuo em nuvem para empresas to collect events, logs and configs 24/7, correlate them and raise alerts when something smells off. Think about it as a health monitor for your cloud: heart rate, blood pressure, temperature. When one metric spikes, you don’t wait for a quarterly check‑up, you react immediately. This approach is critical in elastic environments where resources appear and disappear in minutes, and any manual, spreadsheet‑driven control is doomed to fail from day one.
Key concepts: from events to meaningful alerts
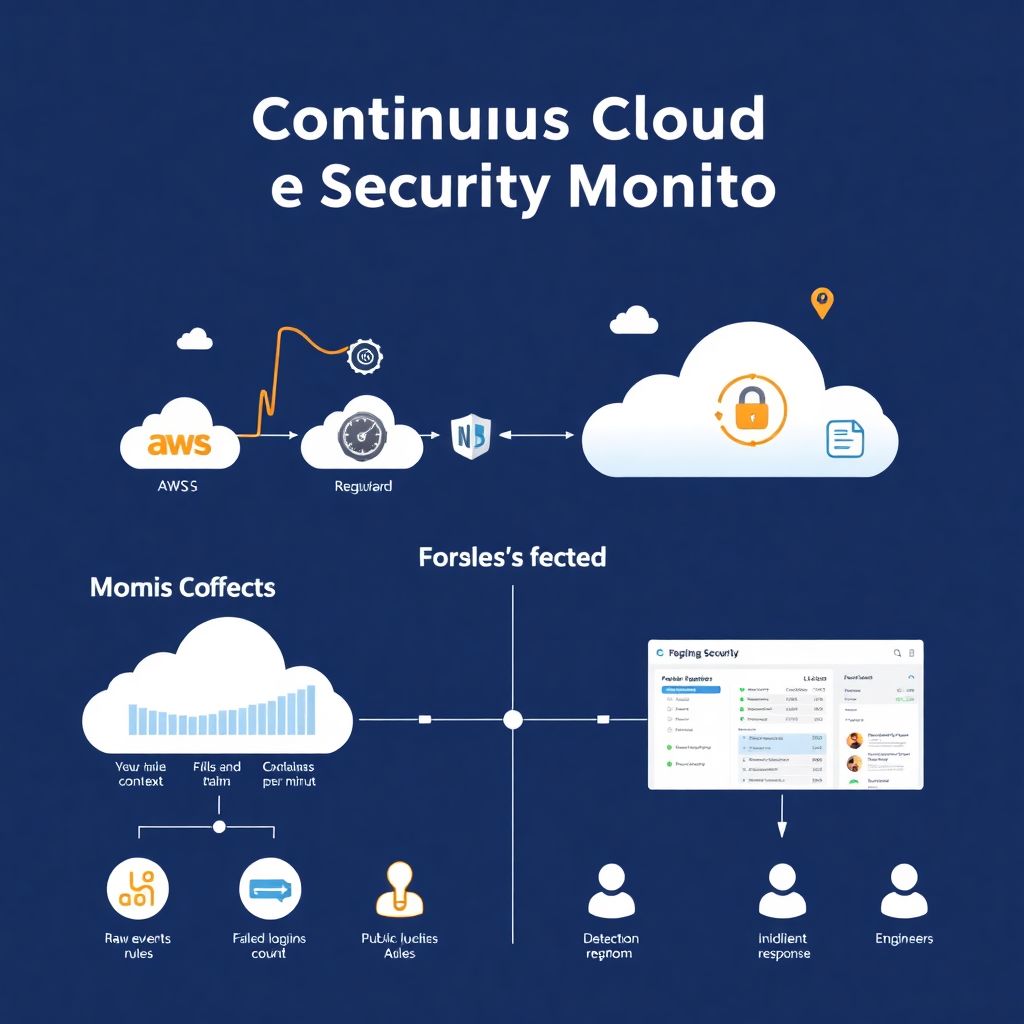
Before choosing ferramentas de monitoramento de segurança em cloud, it helps to nail a few definitions. “Event” is any security‑relevant fact: login, API call, config change, new VM, new container image. “Metric” is a number aggregating many events, like “failed logins per minute” or “public S3 buckets count”. “Alert” is a rule that turns metric changes or specific events into a message that someone must act on. [Diagram: Raw events → metrics & context → detection rules → alerts → incident response]. When you design monitoring, don’t start with tools; start with the alerts you’d like to receive and work backwards to which metrics and logs you must collect to make them reliable instead of noisy.
What “continuous monitoring” looks like in real life
In a real environment, continuous monitoring is a pipeline, not a single tool. Cloud providers send audit logs and flow logs; platforms de segurança em cloud com alertas em tempo real ingest them, enrich with identity and asset data, and push highlighted incidents into your chat or ticketing system. [Diagram: Cloud accounts → log collectors → SIEM / cloud security platform → alert channels → engineers]. For example, a new internet‑facing VM shows up with an open SSH port; five minutes later an unknown IP starts brute‑forcing passwords; then an admin token is used from a foreign country. Proper monitoring will see this as one story and raise a single high‑priority alert, not 500 disconnected log entries that nobody has time to read.
Tool types: who does what in the stack
There’s no single “magic” software here; you combine several tipos de ferramentas de monitoramento de segurança em cloud. First, cloud‑native services like AWS CloudTrail, Azure Activity Log and GCP Audit Logs give you the raw security trail. Then SIEM or log analytics (Splunk, Elastic, Datadog) help correlate events across accounts and regions. On top of that, you’ll probably use a CNAPP or CSPM tool to continuously assess misconfigurations. Finally, you plug in software de monitoramento de vulnerabilidades em cloud corporativa to scan images, containers and hosts. Compared with traditional on‑prem security tools, cloud‑aware platforms understand identities, tags, serverless and managed services, so alerts are more contextual and less noisy.
Dashboards and metrics that actually help you decide
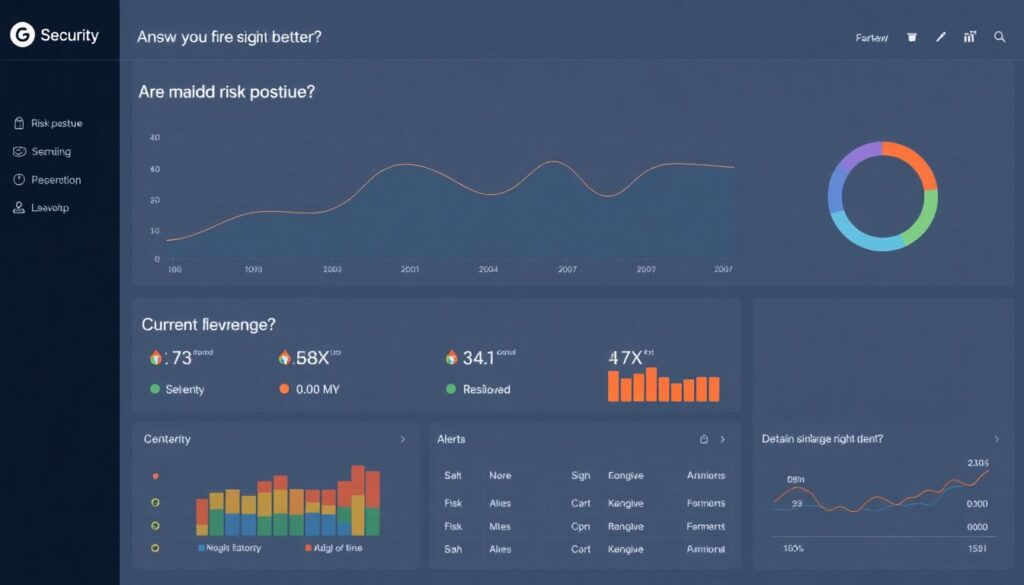
Soluções de segurança em nuvem сom dashboards e métricas are useful only if they answer two questions: “Are we getting better?” and “Do we have a fire right now?”. [Diagram: Top panel – risk posture over time; middle – current incident queue; bottom – detailed drill‑downs by account/app]. For posture, track metrics like number of critical misconfigurations, percentage of encrypted storage, MFA adoption, unused high‑privilege roles. For active threats, focus on anomalies: unusual login locations, spikes in denied firewall traffic, data egress jumps from storage, new public endpoints created outside deployment windows. If a widget doesn’t directly impact a decision (“investigate”, “accept”, “prioritize later”), it’s decoration you can safely remove.
Designing alerts that engineers won’t ignore
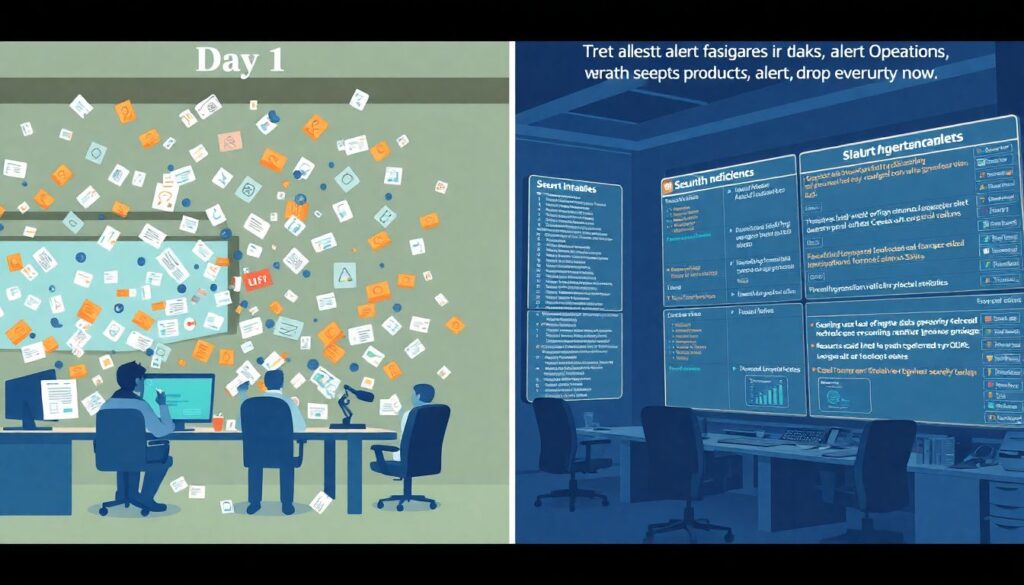
A common failure is turning on every alert and flooding Slack on day one. Instead, treat alert rules as a product. Start with a short list of “drop everything now” cases: suspicious use of admin roles, disabling logging, making data buckets public, spinning up resources in forbidden regions, or mass creation of tokens. [Diagram: Alert tiers – Critical (wake people), High (same‑day), Medium (backlog)]. For each alert, define: data source, exact condition, owner, and required response. Hook alerts into the tools teams already live in (Jira, Slack, Opsgenie) and add runbooks directly in alert text, so whoever is on call knows what “good” looks like and what to check first without hunting for a wiki link.
Comparing providers and platforms: what to look for
When you evaluate plataformas de segurança em cloud com alertas em tempo real, ignore logo size and focus on fit. Check cloud coverage: does it support all your providers and services, or just EC2‑style VMs? Look at deployment model: agent‑based, agentless via APIs, or hybrid; some teams hate agents inside production workloads. Ask how policies are expressed: point‑and‑click, policy‑as‑code, or both. Compare enrichment quality: are alerts tied to business context, like “customer‑facing payment API”, or just “instance i‑0abc123”? Finally, test noise level: run a pilot for a month, measure number of high‑severity alerts that led to real action. Tools with lots of “theoretical” risks but no incidents will get muted, which is worse than not having them at all.
Practical setup: a minimal but solid pipeline
If you’re starting from scratch, aim for a minimal viable monitoring stack instead of a grand design. Begin by enabling all security‑relevant cloud logs and sending them to a central account. Plug a lightweight SIEM or log analytics service on top and define 5–10 essential detections: public storage, disabled logging, failed logins spike, new admin roles, anomalous data egress. Then add a CSPM / CNAPP that continuously checks configs against benchmarks and your own rules. Later you can layer dedicated software de monitoramento de vulnerabilidades em cloud corporativa to catch OS and library issues. This incremental path keeps costs predictable and avoids overwhelming the team with dashboards they don’t have time to understand.
Everyday workflows and incident handling
Continuous monitoring only pays off when it becomes part of daily work, not a side project. Reserve a brief “cloud security stand‑up” a few times a week where someone reviews new alerts, acknowledges false positives and tunes rules. During incidents, your ferramentas de monitoramento de segurança em cloud should act as a time machine: you must quickly replay who changed what, which IPs connected, what data moved where. [Diagram: Incident timeline – initial trigger → correlated events → scope definition → containment steps]. Afterwards, capture lessons directly as new metrics or rules. For example, if an intern exposed a test bucket, add an automated detection preventing any new public bucket in non‑prod accounts, instead of just telling people “be careful next time”.
Maturing over time: from basic checks to proactive defense
As your environment grows, simple checks won’t be enough. Mature serviços de monitoramento contínuo em nuvem para empresas start combining behavioral analytics, threat intel feeds and identity context. For example, a login from a new country is low risk by itself, but if it’s followed by privilege escalation and mass data access, it should jump to the top of the queue. Over time, tie monitoring into CI/CD: block deployments that would introduce critical misconfigurations, and scan images before they ever hit production. The goal is to prevent risky states from appearing at all, so real‑time alerts become exceptions, not the primary defense. Done right, your monitoring shifts from “after‑the‑fact logging” to a practical guardrail system that quietly keeps engineers out of trouble.